
SA Weather Reports analysis | 13 November 2026
El Niño is still strengthening. Why lower record odds don't give South Africa an all-clear
The latest November assessment lowers the chance of a historically intense El Niño, but keeps a strong-to-very-strong event likely into early 2027. For South Africa, the important questions are how the rainfall and temperature outlooks are changing, and how much confidence to place in them.
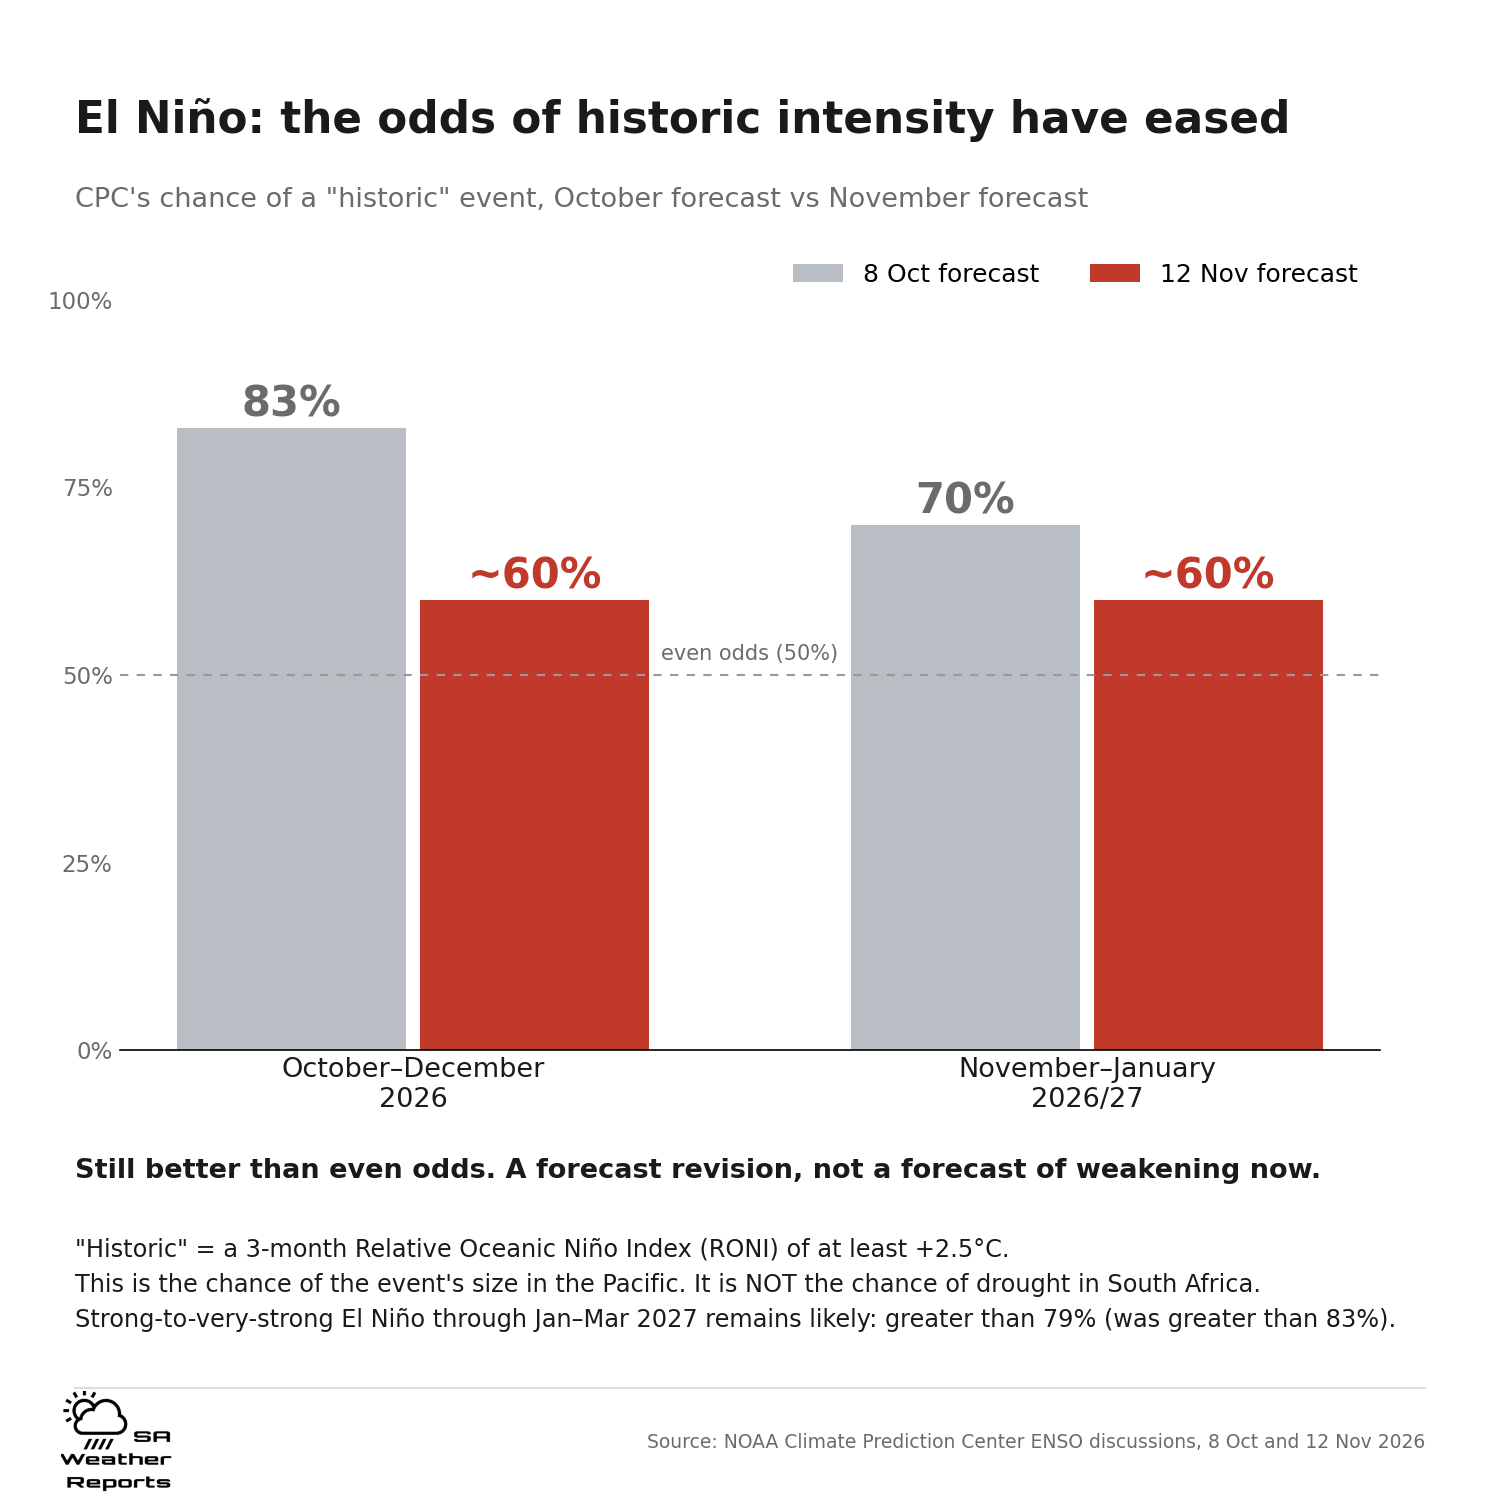
Historic-intensity event: About 60% for Oct-Dec and Nov-Jan
Strong to very strong: Greater than 79% through Jan-Mar 2027
South African drought: Neither percentage is a drought probability
The change: less certainty about a record, not an end to El Niño
NOAA's Climate Prediction Center issued its new assessment on 12 November. It says El Niño continues to strengthen and gives a greater than 79% chance of strong-to-very-strong conditions through January-March 2027. At the same time, its estimate for a historic event is now about 60% for both October-December and November-January.
That is lower than the 8 October assessment: 83% for October-December and 70% for November-January. For the directly comparable October-December period, the change is roughly 23 percentage points. It is a revision to the probability of crossing a particular strength threshold, not a report that the Pacific has cooled by 23%, and not a 60% probability of drought in South Africa.
Our earlier articles described the assessment available when they were written and flagged the November checkpoint. This is that next assessment. The dated earlier reports remain part of the record; today's update explains what has changed and what still needs watching.
Sources: NOAA CPC: 12 November 2026 ENSO discussion · NOAA CPC: 8 October 2026 discussion (PDF)
Two probabilities, two different questions
The historic-event estimate asks whether the three-month Relative Oceanic Niño Index, or RONI, reaches at least +2.5°C. The greater-than-79% figure concerns strong-to-very-strong conditions lasting through January-March. Different thresholds and forecast periods mean those percentages are not interchangeable.
RONI also needs a little explanation. It measures the temperature anomaly in the Niño-3.4 Pacific region relative to the anomaly across the wider tropical oceans, with an adjustment to keep its overall variability comparable. NOAA adopted it to reduce the problem of a warming tropical ocean making an ordinary comparison with an older climate average harder to interpret.
A single week's ocean-temperature reading, a three-month relative index and a forecast probability answer different questions. Mixing them can make an outlook sound more precise, or more alarming, than the evidence supports. The November message is straightforward: an unusually strong event remains likely, but a new historic threshold is less certain than it looked in October.
Sources: NOAA CPC: 12 November 2026 ENSO discussion · NOAA: Relative Oceanic Niño Index information circular
What has not changed for South Africa
The local seasonal outlook still deserves attention. In its Seasonal Climate Watch issued on 31 October, covering November 2026 to March 2027, the South African Weather Service favours below-normal rainfall across large parts of the summer-rainfall region. Its dry signal is especially widespread across the interior and north-eastern half of the country, alongside above-normal daytime and overnight temperatures over most areas.
That is a South African seasonal forecast, not a direct translation of NOAA's 60%. It identifies a background risk of a hotter, drier season across much of the summer-rainfall region. Lower Pacific record odds alone do not cancel that local outlook. But neither the global event label nor the seasonal outlook tells us what every town will experience.
It does not mean every place will be dry, every month will be hotter, or every storm will fail. A three-month average cannot tell us which week will bring useful rain, how long a local dry spell will last, or whether a downpour will bring flooding. Those questions need shorter-range forecasts and conditions on the ground.
Sources: SAWS: Seasonal Climate Watch, November 2026-March 2027
The rainfall picture is not unanimous
A new University of Pretoria seasonal summary, published on 12 November, adds a useful check on sweeping claims. It also indicates below-normal rainfall over much of the region in early summer. By January-March, however, it shows a notable area of above-normal rainfall probabilities over central parts of the region, with below-normal probabilities elsewhere. Some areas have no forecast signal in its summary. "No forecast" is not a forecast of no rain.
That is a more mixed later-summer picture than the broad dry signal described in the 31 October SAWS outlook. These are different forecast products and issue dates, not two measurements that should be averaged into a new percentage. We should acknowledge the difference rather than select the driest map and call it certain.
Above-normal maximum temperatures are a more consistent theme across the two published summaries, although the Pretoria product also has areas without a forecast in some periods. Our reading is to keep heat readiness high, keep the rainfall outlook under review and avoid treating a single nationwide drought narrative as a local forecast.
Sources: SAWS: Seasonal Climate Watch, November 2026-March 2027 · University of Pretoria: November seasonal forecast summary
Why one rainy week would not settle the season
Rainfall timing and distribution matter as well as the seasonal total. A wet week can improve local conditions without proving that the rest of summer will be wet. Equally, a dry start does not establish what every remaining month will bring. A seasonal outlook changes the odds; it does not replace the weather systems that actually deliver rain.
History gives a reason for that caution. In its September statement, quoted by SAnews, SAWS noted that the very strong 1997/98 El Niño coincided with slightly above-normal rainfall over parts of South Africa's summer-rainfall region. Other major events brought widespread drought. The event label alone is not a complete account of the season.
That is why we are not converting the new Pacific probabilities into a dam-level prediction, a count of hot days or a ranking of districts most likely to suffer drought. Those claims would need local evidence beyond this assessment.
What the outlook can and cannot tell you
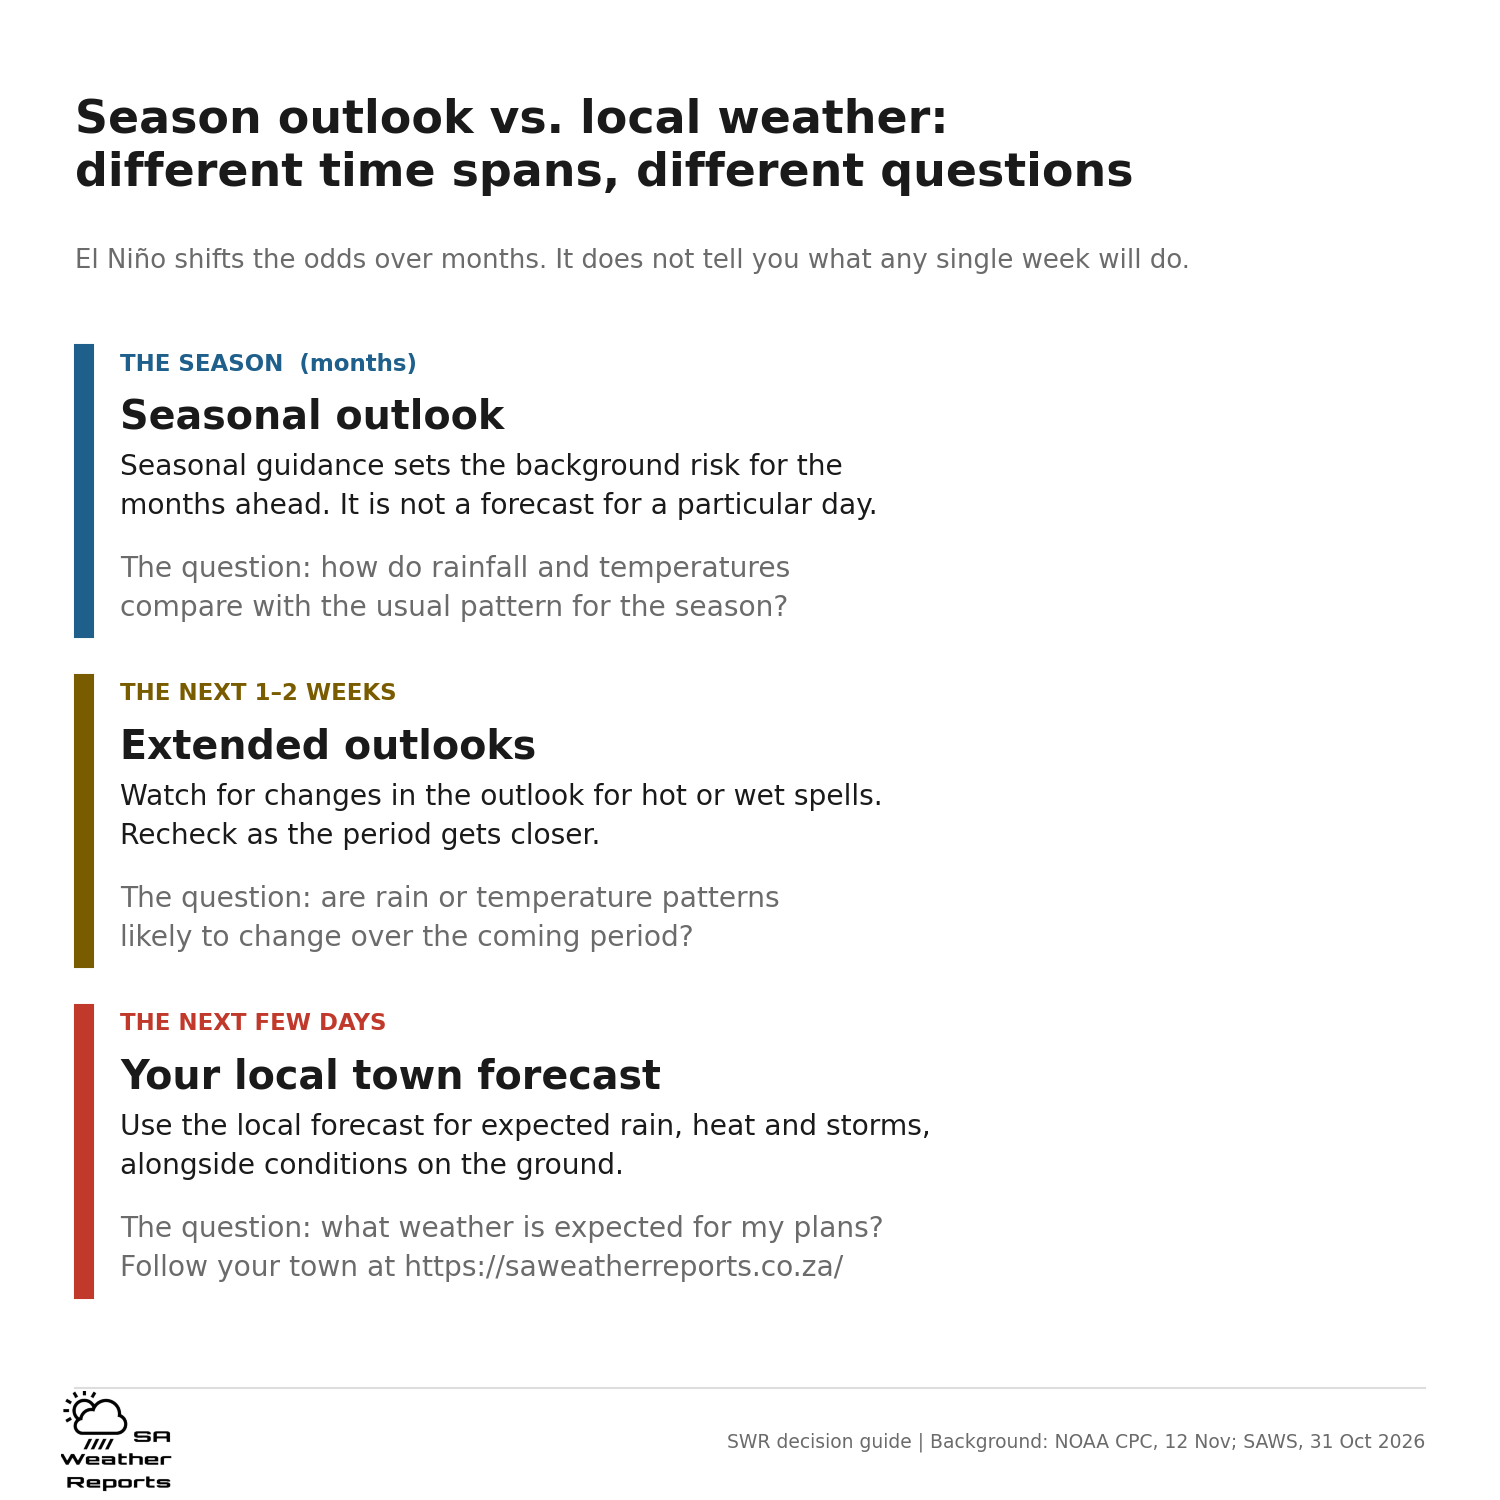
For a general reader, the distinction is between the season's background odds and the weather on a particular day. The seasonal outlook is a reason to keep rainfall and temperature trends in view. It is not a forecast for a school sports day, an outdoor shift, a weekend trip or the next thunderstorm over your town.
Water supply is one area where local evidence matters. A seasonal dry signal does not say how much water is currently stored in a particular dam, what a municipality's supply position is or whether restrictions apply. Those questions need current reservoir information and notices from the responsible local authority. A national El Niño headline cannot stand in for them.
The same distinction matters for heat. Above-normal seasonal temperatures describe a tendency across a period, not a specific day's maximum or the timing of a heatwave. Shorter-range forecasts are the useful guide when considering outdoor work, travel, school activities or exercise. Official severe weather warnings are a separate product from this seasonal analysis.
A rainy forecast for the coming weekend would not contradict a drier seasonal outlook. Nor would a few cooler days disprove a warmer seasonal tendency. Each forecast describes a different time span. Reading them together is more useful than treating one as a replacement for the other.
Our approach is to show what is known at each scale: the Pacific assessment, the South African seasonal guidance and the changing local forecast. Where they leave a question open, we should say so rather than turn an uncertain season into a fixed story for every community.
Sources: SAWS: Seasonal Climate Watch, November 2026-March 2027
What we will watch next
The next CPC ENSO discussion is scheduled for 10 December. Before then, the most useful updates for South Africa are the next local seasonal outlooks, shorter-range rain and temperature forecasts, and observations showing how the season is actually developing across different areas.
We will watch whether local rainfall guidance becomes more consistent, whether the warm signal holds and where emerging conditions begin to differ from the seasonal picture. A changing forecast is a reason to update decisions openly, not to rewrite a dated report as though it always contained today's information.
Our conclusion: lower record odds are meaningful, but they are not an all-clear. South Africa still needs a heat-aware, water-aware summer plan, with room to adjust as local evidence improves. Follow your town's changing forecast at SA Weather Reports.
Sources and dates
Current global assessment, probabilities and next discussion date.
Dated October comparison. The linked advisory files can be replaced with newer editions.
How RONI differs from the traditional index; May 2026.
Issued 31 October. South African seasonal rainfall and temperature outlook.
Published 12 November. A more mixed later-summer rainfall outlook.
1 September. Used for the dated 1997/98 example, not as today's seasonal update.
Reuters report carried by KELO-AM; corroborates the current CPC outlook.
Sources checked 13 November 2026. Seasonal analysis, not an official severe weather warning or a forecast for a specific day.